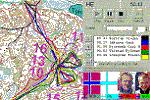
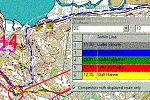
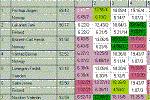
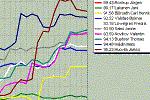
Orienteering Organiser
Analysis modul

A feature of the SPORTident - electronic punching system is the extended result file including all lap times. This rich set of data offers a lot of evaluation possibilities but is not so easy to handle by every runner. Now ii is possible to use the analysis modul.

The modul offers charts, tables, and - as a new feature- race animation with the map-background.
 
Animation Route choice Tables Charts
How you can use Analyses modul for your event evaluation?
You can analyse your competition by using:
  • color split-times table. Color of every split-time shows the level of your mistake.
  • color charts.
            You can analyse split/times, intermediate times, places for both tables and charts.
  • race animation. Animation can run on connections between controls or on runner's routes. You can reduce speed of "run", you can stop animation in any important point and then continue. Competitors can start together or according their real start times.
  • you can study routes of other competitors
  • you can run animation on competitor's routes.
  • You can exchange routes amoung your friends. You can draw your route, export it to a file, send it to a friend. The friend can import it.
  • You can use Split-times - routes viewer - window which allows directly see competitors split-times when you are browsing competitor routes or course on the map.
  • You can compare competitors from different classes (men, women, children and veterans) on the same leg between two controls by a special color table. 
  • You can import large results obtained from www pages and save it (free version allows save only small data).
        Event organisers can use SI Analyser for post event or during event race animation together with national flags and competitor's photos working automatically in neverending loop.
How you can obtain data?
1. You can use data coming from *.oor format and map in *.bmp format available on  SPORTident web page or on pages of organisers of an event.

2. Import data
 a) from CSV file created by OE2000 software

 b) from web page results with split-times:

  1. Johan Modig         10.44.00  1.13.03      1.39  (9)      1.27  (4)
     Pan-Kristianstad                           1.39  (9)      3.06  (3)
  2. Tore Sandvik        11.42.00  1.14.24      1.50 (48)      1.49 (68)
     Halden Skiklubb NOR                        1.50 (48)      3.39 (60)
  3. Hakan Eriksson      11.18.00  1.15.10      1.34  (2)      1.36 (25)
     Malungs OK, Skogsmardarna                  1.34  (2)      3.10  (6)

  This similar results as are shoven above can be imported.

  c) If you have class results with split-times printed on a paper you can create a TXT file with the Notepad. You can only rewrite some runners and only intermediate times. 

  If you have to see animation after data import then you have to draw you course by mouse on the screen. If you can not download map from web you can scan it or you can run animation on the "grey" background. Map is not needed for tables or charts.

 More detail information you will find in OORG help.